2 years ago
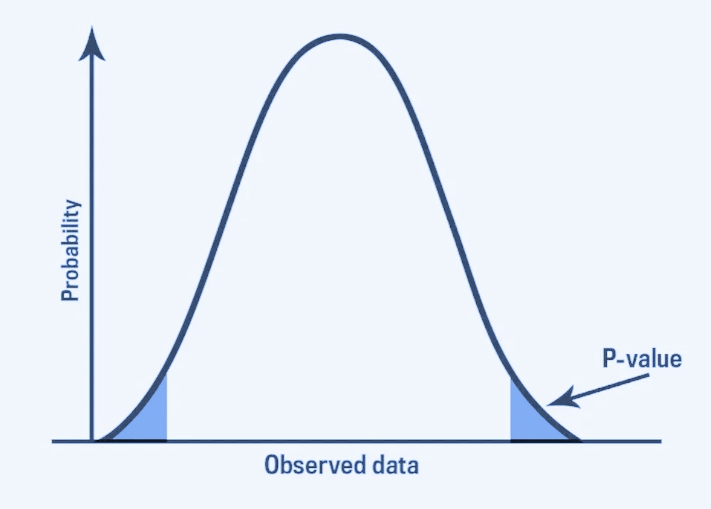
P-value in statistics stands for probability value and it is the area under the curve after the test statistics to the extreme of the graph.
Before diving into the conceptual details, let’s learn the formal definition of P-value first.
“The possibility of getting a calculated/observed difference or an extreme one given that the null hypothesis is true i.e no difference exists between treatments in the population.”
To explain it in simple language, the p-value tells the experimentalist about probability and likelihood. The probability of getting the result from an experiment if the null hypothesis exists.
In a graph, it can be seen as follows.
There is a complete process to find the p-value. The steps are enlisted.
What are test statistics? It is one number that represents all of your data about the sample. After finding that value from a particular test, they are used to find the p-values from the tables.
There are basically 4 types of tests.
Sometimes there are more steps involved depending on the type of test.
Example:
Find the p-value for the following experiment.
James wanted to know if a particular brand of soft drinks filled the bottles according to the status quo i.e 250ml. He took a sample of 100 bottles and measured them.
The z-score for a two-tailed experiment is -0.83.
Solution:
There aren’t many steps needed here. You can simply look for this number on the z-score table. But the preferred way is to go by the method.
Step 1: Make null and alternative hypotheses.
h0 = quantity of soft drink in a bottle is 250 milliliters.
ha = quantity of soft drink in a bottle is different from 250 ml.
Step 2: Find test statistics.
The data for a z test is already given i.e -0.83
Step 3: Find the corresponding value on the standard distribution table.
The value is 0.2033.
Step 4: Since it is a two-tailed test, multiply the table by 2.
= 2 x 0.2033
= 0.4066
This is the p-value.
An alternate option is using the p-value calculator.
P-value is a trial and testing against a null hypothesis. It's always between 0 and 1. If the p-value is less than our established significance level, this means that the null hypothesis is rejected.
Or in words, the chances of getting the same data as ours are nearly impossible. This indicates that the experiment supports the alternative hypothesis.
Conversely, if it is higher than the significance level, that means the null hypothesis is not rejected. Or it IS possible to get a similar sample data as the recently conducted experiment.
In the latter case, the null hypothesis withholds and there is nothing wrong with it.
The null hypotheses are assumptions similar to the ones we make daily. For example, you see a trash can and assume there is trash in it or you eat ice cream and before eating it you assume it is cold.
Basically, anything that is normal. That is as it should be.
Another case of the null hypothesis is when you see stats or status quo. For example, a school’s website says each lecture is 45 minutes long in their institute. This is the assumption or null hypothesis.
Note: School gave a status quo and the “viewers” made the assumption. keep the difference in mind.
On the other hand, the alternative hypothesis is the opposite situation of the null hypothesis. Take the same example of lecture timing. The alternative hypothesis is that the lecture is not 45 minutes long. It is less or more than that.
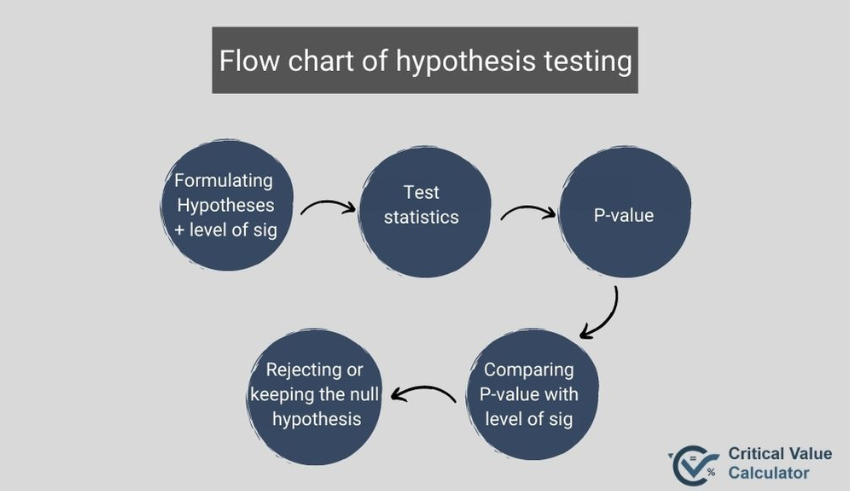
To test whether the null hypothesis is rejectable or upheld, the statisticians perform the hypothesis testing.
You can see that the p-value is the third step after making the null and alternative hypotheses and computing the test statistics.
Take the previous example of lecture duration again.
Null hypothesis = h0 = Lecture is exactly 45 minutes long.
Alternative hypothesis = ha = lecture is NOT 45 minutes long.
For the experiment, we note the timing of 50 lectures and the mean timing is 45 minutes and 37 seconds. Now, is this data variation extreme enough to reject the null hypothesis?
Unless you are inhumanly punctual, it is impossible to remove this difference. So that means probably not, this data is not strong enough to reject the null hypothesis.
But since there is no certainty, we will use the P-value. By calculating the p-value, we will see how often this difference occurs in different samples of lectures if the null hypothesis is true.
Let’s say that its value is 0.193 or 19.3 percent. It means that there is a 19.3 percent chance that this difference occurs. This is well above the standard significance level i.e 0.05 hence the data do not reject the h0.
Ultimately, the conclusion is that the viewer is right about their assumption of lecture duration.
When we talk about the null hypothesis being true, it does not mean it has to be the exact case every single time i.e the school says every lecture is 45 minutes.
It is impossible for mistake-prone humans to achieve ideal results. If it was possible then there would have been no need for a p-value. You will have to simply take a sample and see if it were exactly the same as the assumption.
If the data said the timing was full 45 minutes for every lecture it would have meant the null hypothesis is true and in any other case, it would have been rejected. We would also have no use of means.
But the p-value will tell if the school is even trying their best to get the lecture timing to the said time. If it is the case, then you will see a little difference in the lecture timings, possibly one or two minutes up and down.
If they aren’t then the data difference and standard deviation will be extremely variable and this will surely reject our assumption of school timing.
Calculation of p-values and different types of tests is a whole pandora's box.
This article was mainly focused on the meaning, importance, and use of p-value. Hopefully, you have a clear concept of probability by now.
Criticalvaluecalculator.com is a free online service for students, researchers, and statisticians to find the critical values of t and z for right-tailed, left tailed, and two-tailed probability.