1 year ago
When delving into the world of hypothesis testing in statistics, one term that you will frequently encounter is the "t critical value." But what exactly does it mean, and why is it so important in the realm of statistical analysis?
This article will break down the concept of the t critical value, explaining its definition, how to calculate it, and how to interpret its results with easy-to-understand examples.
The t critical value is a key component in the world of hypothesis testing, which is a method statisticians use to test the validity of a claim or hypothesis.
In simpler terms, when researchers want to understand if the difference between two groups is significant or just happened by chance, they use a t-test and, by extension, the t critical value.
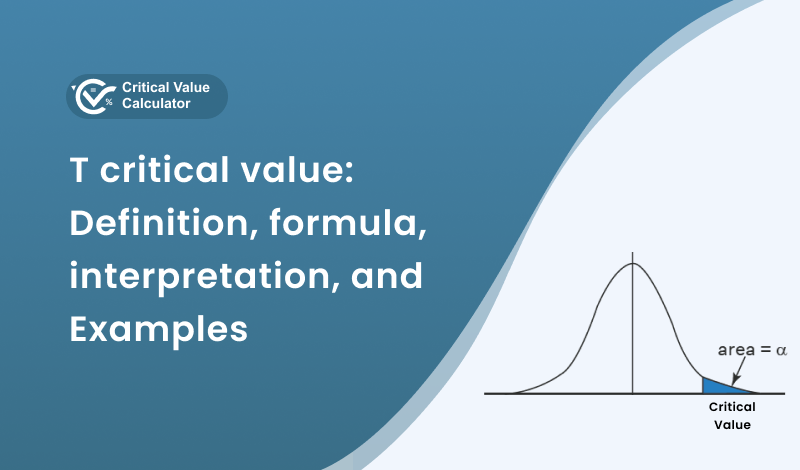
The "t" in the t critical value comes from the t-distribution, which is a type of probability distribution. A probability distribution is essentially a graph that shows all possible outcomes of a particular situation and how likely each outcome is.
The t-distribution is used when the sample size is small, and the population variance (i.e., how spread out the data is) is unknown.
The formula for calculating the t critical value is as follows:
\[t = \frac{(\bar{X}_1 - \bar{X}_2)}{(s_p \sqrt{\frac{2}{n}})}\]
Where:
This formula helps to calculate the difference between the average values of the two groups, taking into account the variability of the data and the sample size.
Once the t critical value has been calculated, it can be compared to the t distribution to determine the significance of the results.
Imagine a teacher who wants to know if a new teaching method is more effective than the traditional method. They divide their students into two groups: one group is taught using the new method, and the other group is taught using the traditional method. After a test, they calculate the average scores of the two groups and use the t-test formula to find the t critical value.
If the t critical value is greater than the critical value from the t-distribution, the teacher can conclude that the new teaching method is significantly more effective than the traditional method.
To calculate the t critical value, you will need the following information:
The level of significance (α): This is the probability of rejecting the null hypothesis when it is true. Common levels of significance are 0.05, 0.01, and 0.10.
The degrees of freedom (df): This value depends on the sample size and the type of t-test you are conducting. For a one-sample t-test, the degrees of freedom is equal to the sample size minus one (n - 1). For a two-sample t-test, the degrees of freedom can be calculated using the formula:
\[df = \frac{\left(\frac{s_1^2}{n_1} + \frac{s_2^2}{n_2}\right)^2}{\frac{\left(\frac{s_1^2}{n_1}\right)^2}{n_1 - 1} + \frac{\left(\frac{s_2^2}{n_2}\right)^2}{n_2 - 1}}\]
Here
The type of t-test: There are different types of t-tests, including one-sample, two-sample, and paired-sample t-tests. The type of t-test you are conducting will affect the degrees of freedom and the critical value.
Once you have this information, you can use a t-distribution table or statistical software to find the t-critical value.
Note: A table is provided at the end of the article.
Scenario:
Suppose you are conducting a study to compare the test scores of two different teaching methods. The collected data from two independent samples is:
You want to test the null hypothesis that there is no significant difference between the two teaching methods at a 0.05 level of significance.
Steps to Calculate the t Critical Value:
Step 1: Calculate the pooled standard deviation (sp).
\[s_p = \sqrt{\frac{{(n_1 - 1) s_1^2 + (n_2 - 1) s_2^2}}{{n_1 + n_2 - 2}}}\]
Substituting the values, we get:
\[s_p = \sqrt{\frac{{(25 - 1) 10^2 + (30 - 1) 12^2}}{{25 + 30 - 2}}}\]
\[s_p \approx 11.1\]
Step 2: Calculate the t-statistic:
\[t = \frac{{50 - 52}}{{11.1 \sqrt{\frac{2}{25}}}}\]
\[t \approx -0.4\]
Step 3: Determine the degrees of freedom (df) for a two-sample t-test:
\[df = \frac{\left(\frac{s_1^2}{n_1} + \frac{s_2^2}{n_2}\right)^2}{\frac{\left(\frac{s_1^2}{n_1}\right)^2}{n_1 - 1} + \frac{\left(\frac{s_2^2}{n_2}\right)^2}{n_2 - 1}}\]
Substitute the values:
\[df = \frac{\left(\frac{10^2}{25} + \frac{12^2}{30}\right)^2}{\frac{\left(\frac{10^2}{25}\right)^2}{25 - 1} + \frac{\left(\frac{12^2}{30}\right)^2}{30 - 1}}\]
\[df \approx 53\]
Step 4: Determine the critical t-value from the t-value table.
For a significance level of 0.05 (two-tailed test), and degrees of freedom (df) closest to 53, you would look up the value in the table. In this case, let's say the critical value for 50 degrees of freedom at the 0.05 significance level is 2.009.
Step 5: Compare the calculated t-statistic to the critical t-value.
In this example, the calculated t-statistic (-0.4) is less than the critical t-value (2.009), therefore we would fail to reject the null hypothesis. This means that there is no significant difference between the two sample means.
In this table, the leftmost column lists the degrees of freedom (df), and the top row lists the significance levels (0.10, 0.05, 0.025, 0.01, and 0.005). Each cell in the table contains the critical t-value for the corresponding degrees of freedom and significance level.
Degrees of Freedom | 0.10 | 0.05 | 0.025 | 0.01 | 0.005 |
1 | 3.078 | 6.314 | 12.706 | 31.821 | 63.657 |
2 | 1.886 | 2.920 | 4.303 | 6.965 | 9.925 |
3 | 1.638 | 2.353 | 3.182 | 4.541 | 5.841 |
4 | 1.533 | 2.132 | 2.776 | 3.747 | 4.604 |
5 | 1.476 | 2.015 | 2.571 | 3.365 | 4.032 |
6 | 1.440 | 1.943 | 2.447 | 3.143 | 3.707 |
7 | 1.415 | 1.895 | 2.365 | 2.998 | 3.499 |
8 | 1.397 | 1.860 | 2.306 | 2.896 | 3.355 |
9 | 1.383 | 1.833 | 2.262 | 2.821 | 3.250 |
10 | 1.372 | 1.812 | 2.228 | 2.764 | 3.169 |
... | ... | ... | ... | ... | ... |
30 | 1.310 | 1.697 | 2.042 | 2.457 | 2.750 |
... | ... | ... | ... | ... | ... |
Here is how you can find the t critical value using this t-distribution table:
For example, if you have 7 degrees of freedom and are conducting a test at the 0.05 significance level, the critical t-value is 1.895.
By understanding the definition, formula, and interpretation of the t critical value, you will be better equipped to evaluate research studies and make informed decisions based on data. So, the next time you come across a study that uses a t-test, you'll know exactly what's going on!
Criticalvaluecalculator.com is a free online service for students, researchers, and statisticians to find the critical values of t and z for right-tailed, left tailed, and two-tailed probability.