Give Feedback What do you think of confidence interval calculator?
 Worst
Worst
 Poor
Poor
 Average
 Good
Good
 Excellent

Confidence interval calculator finds the confidence range in which the population mean may lie. The results are detailed and clear.
The confidence interval for the population mean calculator computes the interval for both calculated values and raw data. You can find the 85, 95, 99, and even 99.9 percent confidence levels.
In statistics, a confidence interval is a range calculated using the sample data in which the population mean lies. It is used to make an estimate and usually involves a margin of error.
The 2 values of the range are called upper and lower bound values respectively and the calculator above can find them.
There is always a certain level of confidence involved. A confidence level tells how sure you can be that the population mean actually lies in the calculated range.
This technique is used when the population means is impossible to calculate due to its size or some other factor. This is why the confidence level of a confidence interval can never be 100 percent.
Example:
Examples always help to understand concepts better. Say there is this luxury chocolate shop with numerous racks filled with chocolate boxes.
You start reading the prices and find that the sample mean of 50 boxes is 40 dollars. Also, the standard deviation is 3.
Now you find a confidence interval with a 99 percent confidence level (which will be taught later in the article) and it is as shown below.
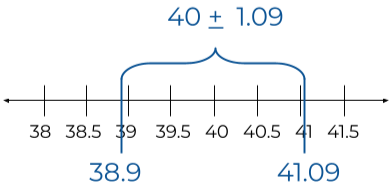
There is a 90 percent chance that the mean price of all the chocolate boxes in the shop will be in the range of [38.9, 41.09]. But there is a 10 percent chance that the mean will be outside of this range.
In other words, let’s say you read the price of every box 100 times and found the mean. The mean will be 90 times in the range and 10 times outside the range.
The population mean calculated using the confidence interval can never be 100 percent accurate. Maybe there is a box in the shop with a price tag of 500 dollars, who knows. That will disrupt the whole calculation.
But based on the sample, we make an estimated range. Only a hundred percent confidence level can tell you whether your assumption or calculation of the range was accurate or not.
But then again, if computing population mean was possible, why would we need a confidence interval?
You can find this range using the given formula.
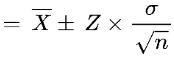
In this formula:
The confidence interval formula includes a couple of values that need to be determined first. Hence, the process is quite lengthy and involves a number of steps.
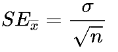
The formula for standard error is
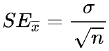
Find the standard error i.e divide the standard deviation by under root n.
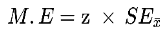
The formula is simple. Multiply z score with the standard error.
The table ahead contains all the popular confidence levels with their z-scores.
| Confidence Interval | Z |
| 80% | 1.282 |
| 85% | 1.440 |
| 90% | 1.645 |
| 95% | 1.960 |
| 99% | 2.576 |
| 99.5% | 2.807 |
| 99.9% | 3.291 |
This margin error is one time subtracted and one time added to the sample mean. The resultant values are the range.
lower bound = Sample mean - margin of error
Upper bound = Sample mean + margin of error
Example:
For the following data, find the 99 percent confidence interval.
21, 13, 11, 14, 52, 23, 12, 11, 50, 55, 0, 1, 1, 7, 33, 51, 41, 44, 47, 9, 19, 10, 20, 30, 26, 38, 41, 5, 40, 2, 39, 42, 55, 22, 48, 50
Solution:
Step 1: Count the values.
N = 36
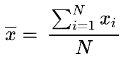
Step 2: Find the sample mean.
= 21 + 13 + 11 + 14 + 52 + 23 + 12 + 11 + 50 + 55 + 0 + 1 + 1 + 7 + 33 + 51 + 41 + 44 + 47 + 9 + 19 + 10 + 20 + 30 + 26 + 38 + 41 + 5 + 40 + 2 + 39 + 42 + 55 + 22 + 48 + 50 / 36
= 983 / 36
= 27.3
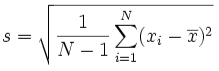
Step 3: Standard deviation.
Sum of Squares:
= (12 - 27.3)2 + (13 - 27.3)2 + (11 - 27.3)2 + (14 - 27.3)2 + (52 - 27.3)2 + (23 - 27.3)2 … (39 - 27.3)2 + (42 - 27.3)2 + (55 - 27.3)2 + (22 - 27.3)2 + (48 - 27.3)2 + (50 - 27.3)2
= 11545.6
Finding variance by dividing this value by the total count
Variance = 11545.6 / 36
= 320.7
On taking square root, we will get the standard deviation.
(variance = standard deviation2)
S.D = 17.9
Step 4: Standard error.
Population S.D (σ) is equal to sample S.D (s) because n > 30.
= 17.9 / √36
= 2.98
Step 5: Margin error.
= z x S.E
The z score for 99 percent confidence level is 2.576
= 2.576 x 2.98
= 7.798
Step 6: Find the lower and upper bound values
Lower bound = 27.3 - 7.798
= 19.51
Upper bound = 27.3 + 7.798
= 35.1
The range is [19.51, 35.1]
Criticalvaluecalculator.com is a free online service for students, researchers, and statisticians to find the critical values of t and z for right-tailed, left tailed, and two-tailed probability.