Give Feedback What do you think of five number summary calculator?
 Worst
Worst
 Poor
Poor
 Average
 Good
Good
 Excellent
5 number summary calculator is an online tool used to calculate the five-number summary of the set of comma-separated values. It also offers the least to the greatest form of the given list of numbers.
A set of descriptive statistics that offers information about a data set is said to be the 5 number summary. The 5 sample percentiles that are offered by a five-number summary are:
Here are the formulas for the five terms of the five-number summary.
Arrange the data set either in ascending or descending order. In the case of ascending order, the first term is the minimum term and the last term is the maximum. While in the case of descending order, the first term is the maximum and the last term is the minimum term.
Take the lower half of the arranged data set and calculate the median of the first half. The first quartile is 25% of the data set. The formula of the lower quartile is:

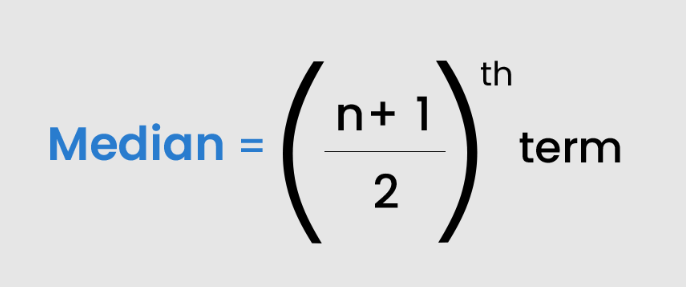
If the total terms of the data set are odd, then the formula of the median is:

If the total terms of the data set are even, then the formula of the median is:

Take the upper half of the arranged data set and calculate the median of the upper half. The third quartile is 75% of the data set.

To learn how to calculate the five-number summary, follow the below example.
Example
Calculate the five-number summary of the given set of data.
23, 7, 18, 5, 12, 13, 25, 8, 19
Solution
Step 1: Frist of all, arrange the data set from least to greatest.
5, 7, 8, 12, 13, 18, 19, 23, 25
Total number of observation = n = 9
Step 2: Now find the maximum and minimum value of the data set.
The first term of the arranged data must be the minimum and the last term must be the maximum.
First term = minimum = 5
Last term = maximum = 25
Step 3: Calculate the first quartile of the data set by using a formula.
First quartile = Q1 = ((n + 1)/4)th term
Put n = 9
First quartile = Q1 = ((9 + 1)/4)th term
= Q1 = ((10)/4)th term
= Q1 = ((5/2)th term
= Q1 = 2.5th term
Hence the first quartile is the 2.5th term of the arranged set of data. It will be the mean of the 2nd and 3rd terms.
First quartile = Q1 = 7 + 8 / 2
= Q1 = 15/2 = 7.5
Step 4: Calculate the second quartile (median) of the data set by using the formula.
Median = Q2 = ((n + 1)/2)th term
Put n = 9
Median = Q2 = ((9 + 1)/2)th term
= Q2 = ((10)/2)th term
= Q2 = 5th term
Hence the median is the 5th term of the arranged data set.
Median = Q2 = 13
Step 5: Calculate the third quartile of the data set by using a formula.
Third quartile = Q3 = (3(n + 1)/4)th term
Put n = 9
Third quartile = Q3 = (3(9 + 1)/4)th term
= Q3 = (3(10)/4)th term
= Q3 = (30)/4)th term
= Q3 = (15)/2)th term
= Q3 = 7.5th term
Hence the third quartile is the 7.5th term of the arranged set of data. It will be the mean of the 7th and 8th terms.
Upper quartile = Q3 = 19 + 23 / 2
Upper quartile = Q3 = 42/2
Upper quartile = Q3 = 21
Step 6: Write all the results of the five-number summary:
Minimum term = 5
First quartile = Q1 = 7.5
Median = Q2 = 13
Third quartile = Q3 = 11
Maximum term = 25
