To use this sample z score calculator, follow the below steps.
Give Feedback What do you think of z score calculator?
 Worst
Worst
 Poor
Poor
 Average
 Good
Good
 Excellent

Find the z score of a statistical dataset using this z score calculator. It works with three different types of inputs:
It will calculate the z score for each value separately on inputting data points. For the other two inputs, the overall z-score is given. Z-Score table calculator gives the standard normal distribution graph.
Z-score goes by the name normal score and standard score also. This is why this calculator is called a standard normal table calculator.
Z-score is a statistical measure that helps evaluate the distance of each entry in a dataset from its mean value, expressed in terms of standard deviation. It allows us to understand how far away a particular value is from the sample's mean.
The Z-score calculation involves taking the difference between the value and the mean, and then dividing it by the standard deviation. A Z-score of 0 indicates that the value is equal to the mean, while a positive or negative Z-score indicates that the value is above or below the mean, respectively.
Think of standard deviation as a unit of measurement, similar to feet or inches, that provides context for the distances between individual data points and the mean.
Example:
For more clarity, Consider an example. Let’s say we calculated the standard deviation for a dataset and it was 10. Also, assume that its mean is 40.
We will make a scale of this data set like this:
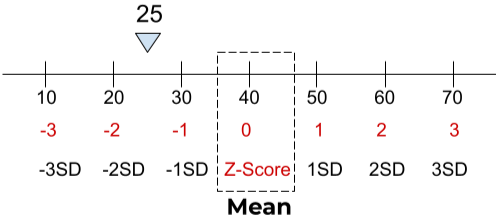
In this scale, every 10 units is equal to one standard deviation, as it was calculated. Now, let’s say one entry from the dataset is 25 and you want to find its z-score.
What will be its z-score? First, we know that 24 is smaller than 40, so the z-score is negative.
Next, it lies in the half of 20(-2 standard deviation) and 30 (-1 standard deviation). It is obvious that the point is -1.5 Standard deviations away from the mean.
The z-score formula for data points
z = (x – µ)/σ
The z-score formula for sample mean & size
z = (x̄ – µ)/ (σ/ √n)
The z-score formula for sample data
z = (x̄ – µ)/ (σ/ √n)
In the above equations,
To find the z-score value, use the z-score probability calculator above. The manual method for finding the z-score is given below.
Example 1: For Sample Data
What are the z-score values for the following inputs?
Solution:
Step 1: Count the entries.
n = 7
Step 2: Take the formula for finding the z-score from the sample set of data values.
z = (x̄ – µ)/ (σ/ √n)
Step 3: Find the sample mean.
x̄ = [42 + 54 + 65 + 47 + 59 + 40 + 53] / 7
= 360 / 7
= 51.4
Step 4: Put the values into the above formula.
z = (51.4 – 50)/ (16/√7)
z = (1.4)/(16/2.65)
z = (1.4)/(16/2.65)
z = 1.4/6.04
z = 0.2318
Example 2: For Data Points
What are the z-score values for the following inputs?
Solution:
Step 1: Take the formula for finding the z-score from the data points.
z = (x – µ)/σ
Step 2: Put the values to the above formula.
z = (8 – 20)/10
z = -12/10
z = -.12
Example 3: For sample mean and size
What are the z-score values for the following inputs?
Solution:
Step 1: Take the formula for finding the z-score from the sample set of data values.
z = (x̄ – µ)/ (σ/ √n)
Step 2: Put the values into the above formula.
z = (19 - 15) / (12/√9)
z = (4) / (12/3)
z = 4/4
z = 1
Criticalvaluecalculator.com is a free online service for students, researchers, and statisticians to find the critical values of t and z for right-tailed, left tailed, and two-tailed probability.